

Since the Common App debuted in 1998, applying to multiple schools at once has been easier than ever. It's also made some colleges even harder to get into.
Stacker used the most recent data from the National Center for Education Statistics to rank the 25 hardest colleges to get into across the U.S. Schools are ranked by 2022 acceptance rates and supplementary test score data is included where available. Ranked colleges are limited to those with at least 500 undergraduate students. Online colleges aren't included.
Before the internet, high school students usually applied to a small selection of colleges and submitted individual forms in the mail. But the Common App, now used by more than 1,000 colleges, features a single application that serves as a platform for standardized essay prompts and the submission of transcripts and test scores. Individual schools may decide to add additional components, such as short response questions; but in general, high school students save time not having to fill out multiple applications.
During the 2021-2022 season, students on average applied to six colleges, up from around four for 2013-2014. Students who score above 1500 on the SAT tend to apply to the most schools, including the more selective ones. As a result, the most prestigious schools are getting more qualified applicants than before. Harvard University's acceptance rate in 1991 was 17%; today, it's in the single digits.
What makes an applicant competitive to the most selective schools in the country? Traditionally, a strong GPA and standardized test score laid the foundation for other considerations, including essay strength, extracurricular participation, and interview success.
However, during the COVID-19 pandemic, more schools—even highly selective ones—dropped the requirement to submit ACT or SAT scores. For the 2022-23 application season, only 2 in 5 (43%) applicants included test scores.
But test-optional admissions policies are now being reversed. Dartmouth College, Yale University, and Brown University are among the colleges bringing back required standardized test scores for the upcoming application season.
Keep reading to discover the most selective colleges in the U.S.
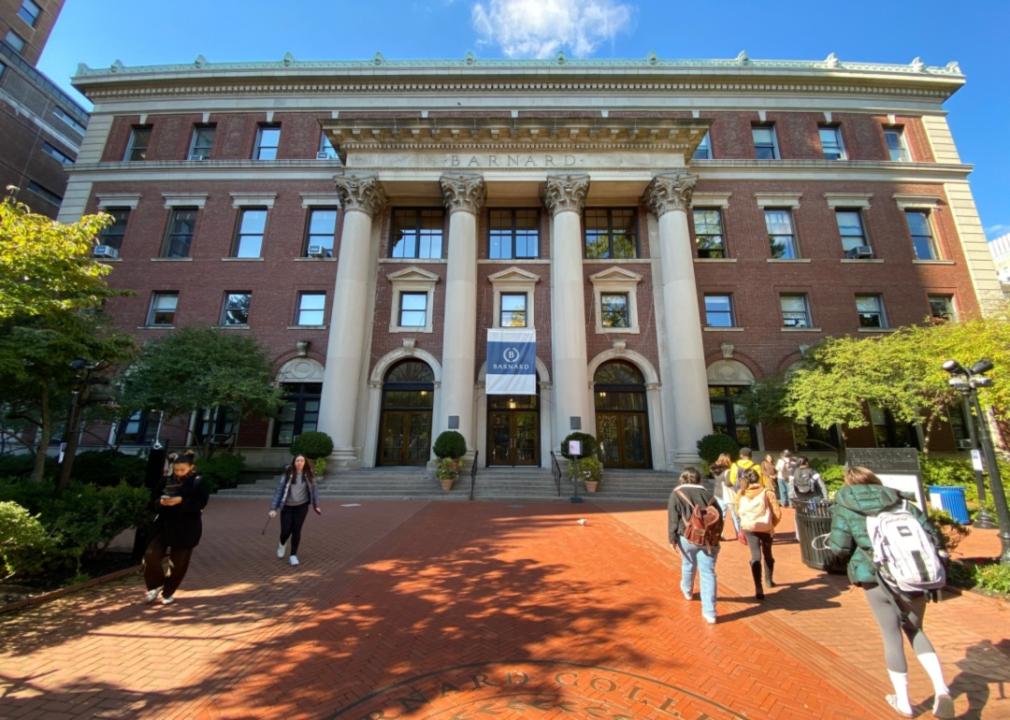
- New York City
- Acceptance rate: 8.8% (12,009 applicants, 1,056 admitted, 697 enrolled)
- Total enrollment: 3,442
- Share of applicants submitting SAT scores: 30% (Median score: 1505)
- Share of applicants submitting ACT scores: 20% (Median score: 33)

- Houston
- Acceptance rate: 8.7% (31,443 applicants, 2,730 admitted, 1,203 enrolled)
- Total enrollment: 4,494
- Share of applicants submitting SAT scores: 53% (Median score: 1540)
- Share of applicants submitting ACT scores: 23% (Median score: 35)

- Los Angeles
- Acceptance rate: 8.6% (149,801 applicants, 12,845 admitted, 6,462 enrolled)
- Total enrollment: 32,423

- Williamstown, Massachusetts
- Acceptance rate: 8.5% (15,321 applicants, 1,302 admitted, 577 enrolled)
- Total enrollment: 2,169
- Share of applicants submitting SAT scores: 41% (Median score: 1530)
- Share of applicants submitting ACT scores: 21% (Median score: 35)

- Waterville, Maine
- Acceptance rate: 7.6% (16,890 applicants, 1,286 admitted, 673 enrolled)
- Total enrollment: 2,299
- Share of applicants submitting SAT scores: 42% (Median score: 1490)
- Share of applicants submitting ACT scores: 23% (Median score: 34)

- Ithaca, New York
- Acceptance rate: 7.5% (69,195 applicants, 5,168 admitted, 3,491 enrolled)
- Total enrollment: 15,735
- Share of applicants submitting SAT scores: 37% (Median score: 1530)
- Share of applicants submitting ACT scores: 14% (Median score: 34)

- Amherst, Massachusetts
- Acceptance rate: 7.3% (14,864 applicants, 1,079 admitted, 467 enrolled)
- Total enrollment: 1,898
- Share of applicants submitting SAT scores: 40% (Median score: 1510)
- Share of applicants submitting ACT scores: 21% (Median score: 34)

- Baltimore
- Acceptance rate: 7.3% (37,844 applicants, 2,745 admitted, 1,406 enrolled)
- Total enrollment: 6,044
- Share of applicants submitting SAT scores: 44% (Median score: 1550)
- Share of applicants submitting ACT scores: 15% (Median score: 35)
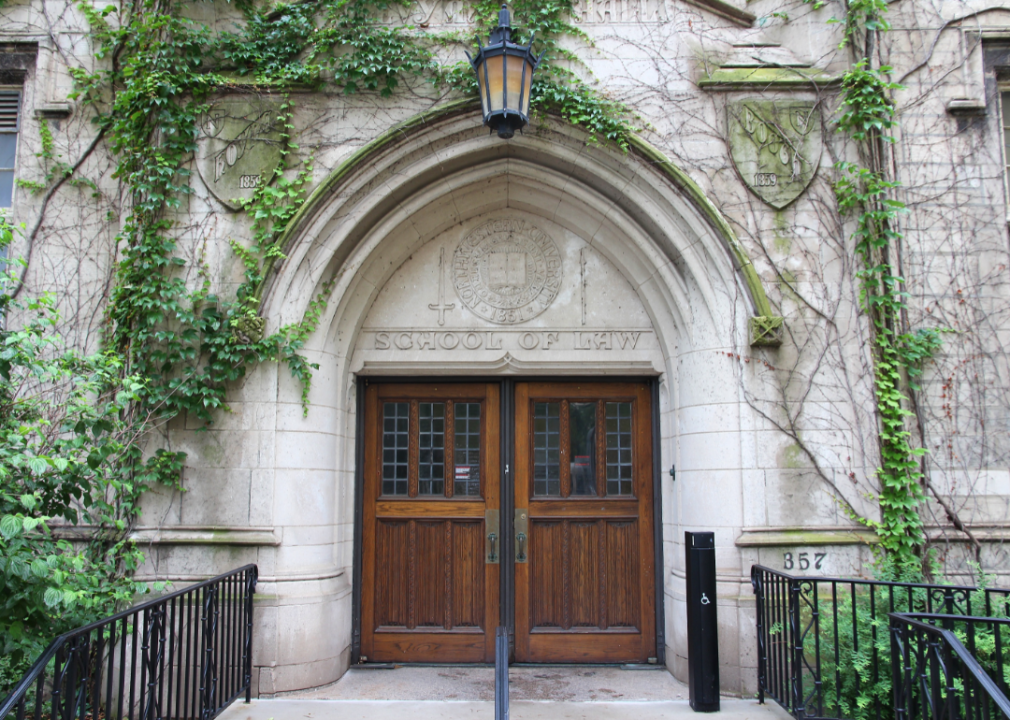
- Evanston, Illinois
- Acceptance rate: 7.2% (51,261 applicants, 3,695 admitted, 2,038 enrolled)
- Total enrollment: 8,993
- Share of applicants submitting SAT scores: 47% (Median score: 1530)
- Share of applicants submitting ACT scores: 31% (Median score: 34)

- Claremont, California
- Acceptance rate: 7.0% (10,666 applicants, 749 admitted, 413 enrolled)
- Total enrollment: 1,716
- Share of applicants submitting SAT scores: 35% (Median score: 1520)
- Share of applicants submitting ACT scores: 18% (Median score: 34)

- Swarthmore, Pennsylvania
- Acceptance rate: 6.9% (14,707 applicants, 1,019 admitted, 433 enrolled)
- Total enrollment: 1,625
- Share of applicants submitting SAT scores: 42% (Median score: 1520)
- Share of applicants submitting ACT scores: 19% (Median score: 33)
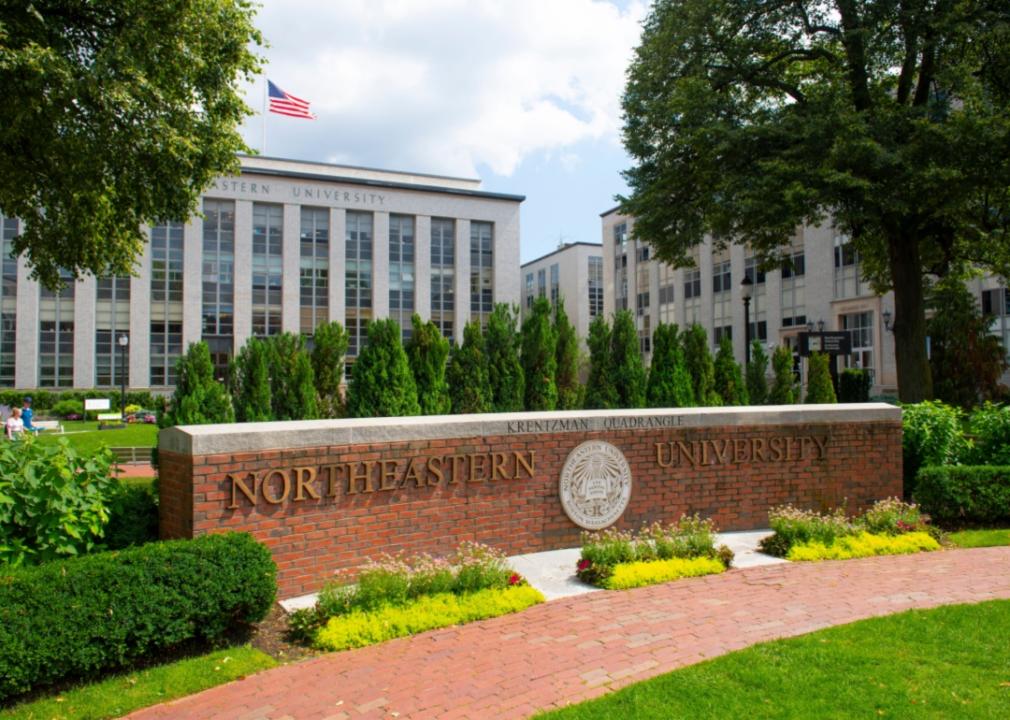
- Boston
- Acceptance rate: 6.8% (91,000 applicants, 6,191 admitted, 2,519 enrolled)
- Total enrollment: 16,302
- Share of applicants submitting SAT scores: 33% (Median score: 1500)
- Share of applicants submitting ACT scores: 11% (Median score: 34)
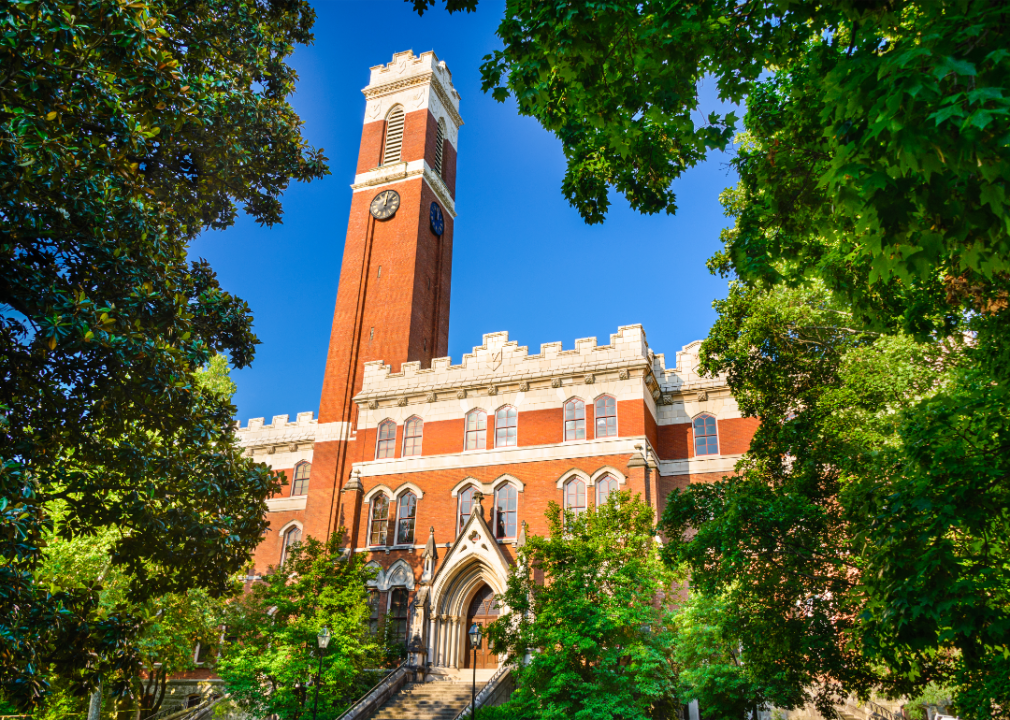
- Nashville, Tennessee
- Acceptance rate: 6.7% (46,377 applicants, 3,093 admitted, 1,619 enrolled)
- Total enrollment: 7,151
- Share of applicants submitting SAT scores: 29% (Median score: 1530)
- Share of applicants submitting ACT scores: 32% (Median score: 35)

- Philadelphia
- Acceptance rate: 6.5% (54,588 applicants, 3,549 admitted, 2,409 enrolled)
- Total enrollment: 11,250
- Share of applicants submitting SAT scores: 48% (Median score: 1540)
- Share of applicants submitting ACT scores: 23% (Median score: 35)

- Hanover, New Hampshire
- Acceptance rate: 6.4% (28,336 applicants, 1,808 admitted, 1,124 enrolled)
- Total enrollment: 4,458
- Share of applicants submitting SAT scores: 42% (Median score: 1550)
- Share of applicants submitting ACT scores: 24% (Median score: 34)
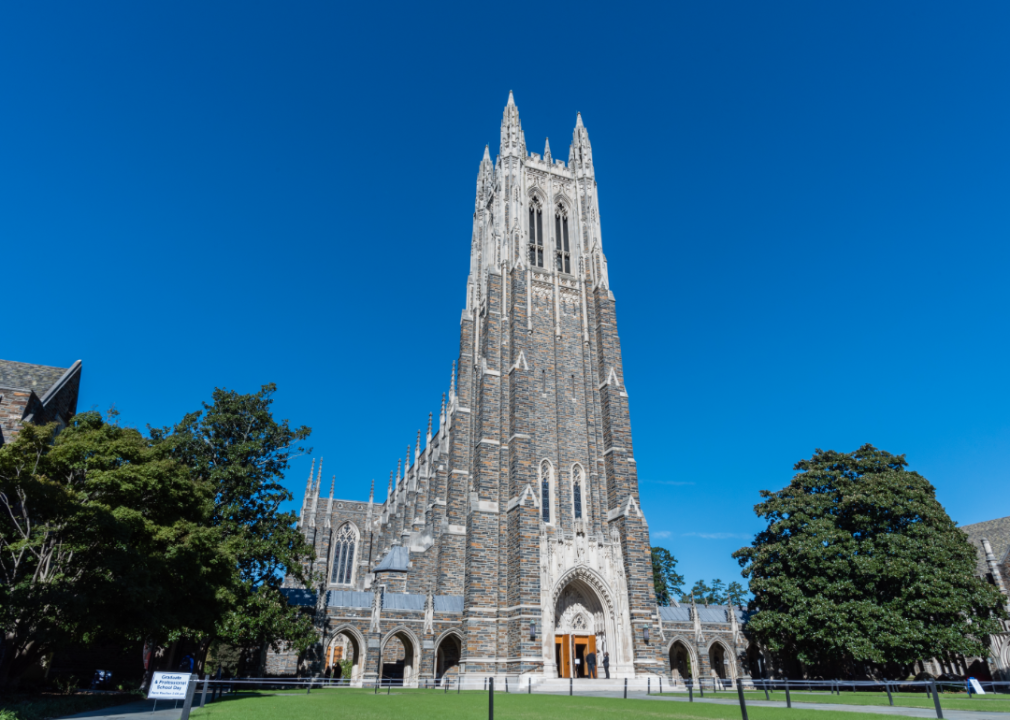
- Durham, North Carolina
- Acceptance rate: 6.3% (50,016 applicants, 3,174 admitted, 1,745 enrolled)
- Total enrollment: 6,640
- Share of applicants submitting SAT scores: 49% (Median score: 1550)
- Share of applicants submitting ACT scores: 37% (Median score: 35)

- Princeton, New Jersey
- Acceptance rate: 5.7% (38,019 applicants, 2,167 admitted, 1,499 enrolled)
- Total enrollment: 5,604
- Share of applicants submitting SAT scores: 59% (Median score: 1540)
- Share of applicants submitting ACT scores: 25% (Median score: 35)

- Chicago
- Acceptance rate: 5.4% (37,522 applicants, 2,039 admitted, 1,729 enrolled)
- Total enrollment: 7,595
- Share of applicants submitting SAT scores: 52% (Median score: 1540)
- Share of applicants submitting ACT scores: 32% (Median score: 34)

- Providence, Rhode Island
- Acceptance rate: 5.1% (50,649 applicants, 2,562 admitted, 1,717 enrolled)
- Total enrollment: 7,639
- Share of applicants submitting SAT scores: 54% (Median score: 1540)
- Share of applicants submitting ACT scores: 27% (Median score: 35)
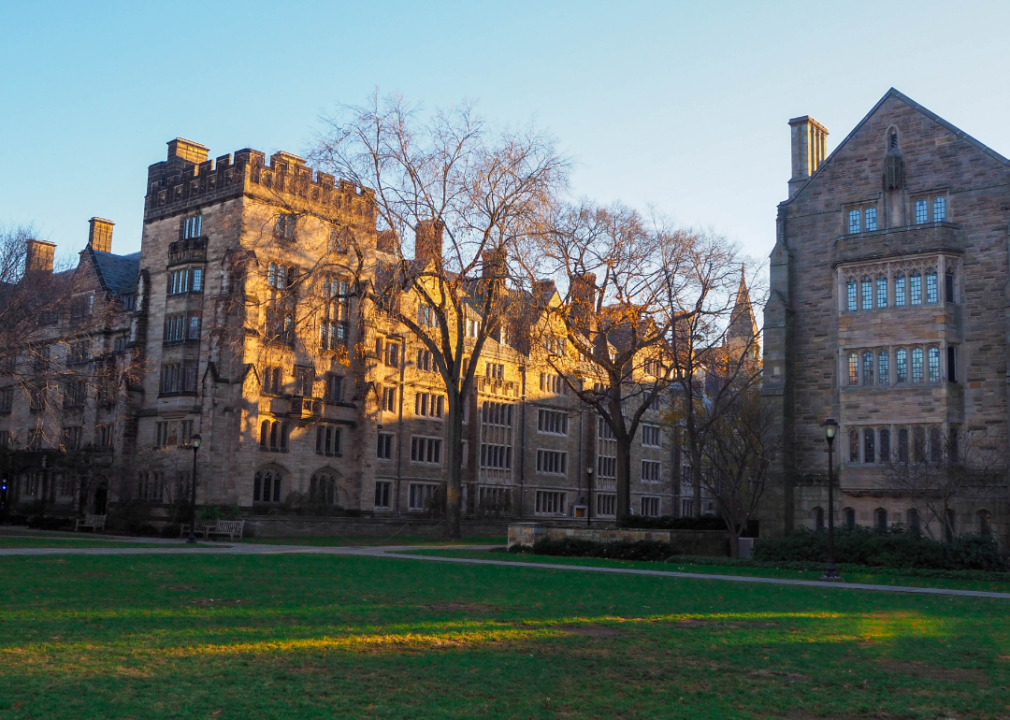
- New Haven, Connecticut
- Acceptance rate: 4.6% (50,060 applicants, 2,289 admitted, 1,554 enrolled)
- Total enrollment: 6,645
- Share of applicants submitting SAT scores: 59% (Median score: 1540)
- Share of applicants submitting ACT scores: 29% (Median score: 35)

- Cambridge, Massachusetts
- Acceptance rate: 4.0% (33,767 applicants, 1,337 admitted, 1,136 enrolled)
- Total enrollment: 4,657
- Share of applicants submitting SAT scores: 78% (Median score: 1560)
- Share of applicants submitting ACT scores: 32% (Median score: 35)

- New York City
- Acceptance rate: 3.9% (60,879 applicants, 2,404 admitted, 1,540 enrolled)
- Total enrollment: 8,902
- Share of applicants submitting SAT scores: 44% (Median score: 1530)
- Share of applicants submitting ACT scores: 23% (Median score: 35)

- Stanford, California
- Acceptance rate: 3.7% (56,378 applicants, 2,075 admitted, 1,736 enrolled)
- Total enrollment: 8,049
- Share of applicants submitting SAT scores: 49% (Median score: 1550)
- Share of applicants submitting ACT scores: 23% (Median score: 35)

- Cambridge, Massachusetts
- Acceptance rate: 3.2% (61,221 applicants, 1,984 admitted, 1,646 enrolled)
- Total enrollment: 9,368
- Share of applicants submitting SAT scores: 55% (Median score: 1550)
- Share of applicants submitting ACT scores: 28% (Median score: 35)
- Pasadena, California
- Acceptance rate: 2.7% (16,626 applicants, 448 admitted, 224 enrolled)
- Total enrollment: 982
Story editing by Nicole Caldwell. Copy editing by Paris Close. Photo selection by Lacy Kerrick.